plot_density_matrix
qctrlvisualizer.plot_density_matrix(density_matrix, basis_labels=None, rotate_column_labels=False, *, figure=None)Create a heatmap with the absolute values of a density matrix’s elements.
Parameters
- density_matrix (np.ndarray) – The density matrix ρ to plot.
- basis_labels (list ( str ) or None , optional) – A list of strings representing the labels of the basis in which ρ is represented. The elements of this list will be decorated with bras/kets and then used as the labels for the axes. Its length must match the dimension of density_matrix. Defaults to [“0”, “1”, …].
- rotate_column_labels (bool , optional) – Whether to rotate the column labels by 90 degrees. Defaults to False.
- figure (matplotlib.figure.Figure or None , optional) – A matplotlib Figure in which to place the plots. If passed, its dimensions and axes will be overridden.
Examples
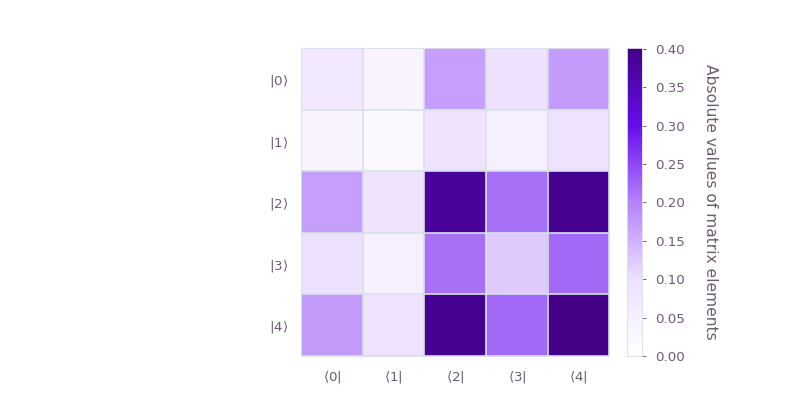
Plot the density matrix of a five-level system.
import numpy as np
from qctrlvisualizer import plot_density_matrix

density_matrix = np.array(
    [
        [0.07554607, 0.03935068, 0.16941076, 0.09644551, 0.17403635],
        [0.03935068, 0.02049711, 0.08824322, 0.05023684, 0.09065261],
        [0.16941076, 0.08824322, 0.37990067, 0.21627735, 0.39027348],
        [0.09644551, 0.05023684, 0.21627735, 0.12312664, 0.22218259],
        [0.17403635, 0.09065261, 0.39027348, 0.22218259, 0.40092951],
    ]
)

plot_density_matrix(density_matrix)