plot_cost_histories
qctrlvisualizer.plot_cost_histories(cost_histories, labels=None, y_axis_log=False, initial_iteration=1, *, figure=None)Create a plot of the cost against iterations for either a single cost history or a set of cost histories.
Parameters
- cost_histories (list) – The values of the cost histories.
Must be either a list of a single cost history or a list of several cost histories,
where each individual cost history is a list.
For example, a single cost history can be passed
(
cost_histories = [0.1, 0.05, 0.02]) or multiple cost histories (cost_histories = [[0.1, 0.05, 0.02], [0.23, 0.2, 0.14, 0.1, 0.04, 0.015]]). - labels (list [ str ] or None , optional) – The labels corresponding to the individual cost histories in cost_histories. If you provide this, it must be the same length as cost_histories.
- y_axis_log (bool , optional) – Whether the y-axis is log-scale. Defaults to False.
- initial_iteration (int , optional) – Where the iteration count on the x-axis starts from. This is useful if you want to include the initial cost—before optimization—at iteration 0 or if you pass cost histories that start at a later iteration. Defaults to 1.
- figure (matplotlib.figure.Figure or None , optional) – A matplotlib Figure in which to place the plots. If passed, its dimensions and axes will be overridden.
Examples
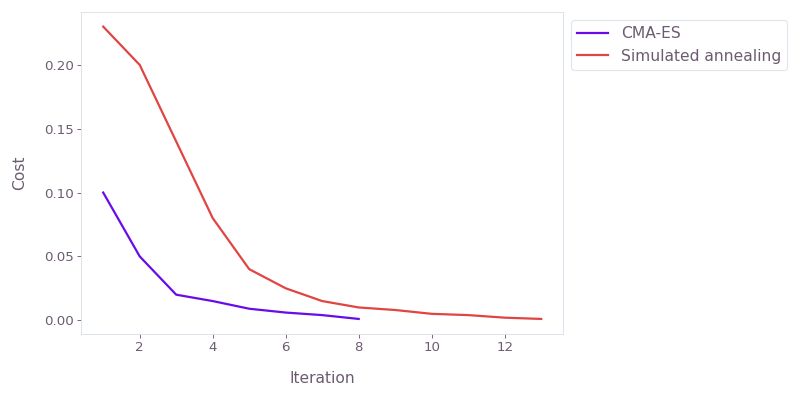
Compare the cost histories of two closed-loop optimizers.
from qctrlvisualizer import plot_cost_histories

cost_histories = [
    [0.1, 0.05, 0.02, 0.015, 0.009, 0.006, 0.004, 0.001],
    [0.23, 0.2, 0.14, 0.08, 0.04, 0.025, 0.015, 0.01, 0.008, 0.005, 0.004, 0.002, 0.001],
]

plot_cost_histories(
    cost_histories=cost_histories, labels=["CMA-ES", "Simulated annealing"]
)