plot_controls
qctrlvisualizer.plot_controls(controls, polar=True, smooth=False, unit_symbol='Hz', two_pi_factor=True, *, figure=None)Create a plot of the specified controls.
Parameters
- controls (dict) – The dictionary of controls to plot. The keys should be the names of the controls, and the values represent the pulse by a dictionary with the ‘durations’ and ‘values’ for that control. The durations must be in seconds and the values (possibly complex) in the units specified by unit_symbol.
- polar (bool , optional) – The mode of the plot when the values appear to be complex numbers. Plot magnitude and angle in two figures if set to True, otherwise plot I and Q in two figures. Defaults to True.
- smooth (bool , optional) – Whether to plot the controls as samples joined by straight lines, rather than as piecewise-constant segments. Defaults to False.
- unit_symbol (str , optional) – The symbol of the unit to which the controls values correspond. Defaults to “Hz”.
- two_pi_factor (bool , optional) – Whether the values of the controls should be divided by 2π in the plots. Defaults to True.
- figure (matplotlib.figure.Figure or None , optional) – A matplotlib Figure in which to place the plots. If passed, its dimensions and axes will be overridden.
Examples
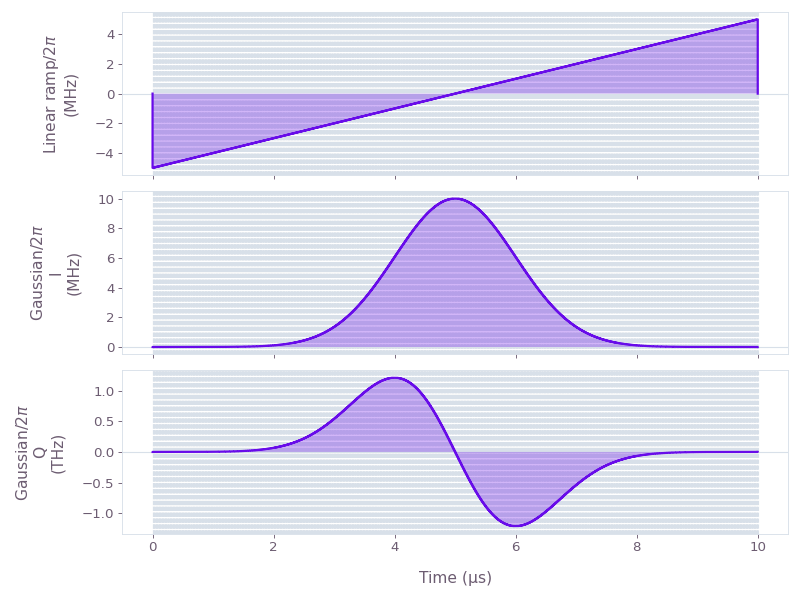
Plot a linear ramp and a Gaussian pulse.
import numpy as np
import boulderopal as bo
from qctrlvisualizer import plot_controls

duration = 10e-6  # s
time_step = 0.01e-6  # s

amplitude = 2 * np.pi * 10e6  # Hz
drag_gaussian = 0.2

linear_ramp = bo.signals.linear_ramp(duration=duration, end_value=amplitude / 2)
gaussian_pulse = bo.signals.gaussian_pulse(
    duration=duration, amplitude=amplitude, drag=drag_gaussian
)

controls = {
    "Linear ramp": {
        "durations": np.full(int(duration / time_step), time_step),
        "values": linear_ramp.export_with_time_step(time_step),
    },
    "Gaussian": {
        "durations": np.full(int(duration / time_step), time_step),
        "values": gaussian_pulse.export_with_time_step(time_step),
    },
}

plot_controls(controls, polar=False)