plot_confidence_ellipses
qctrlvisualizer.plot_confidence_ellipses(ellipse_matrix, estimated_parameters, actual_parameters=None, parameter_names=None, parameter_units='Hz', *, figure=None)Create an array of confidence ellipse plots.
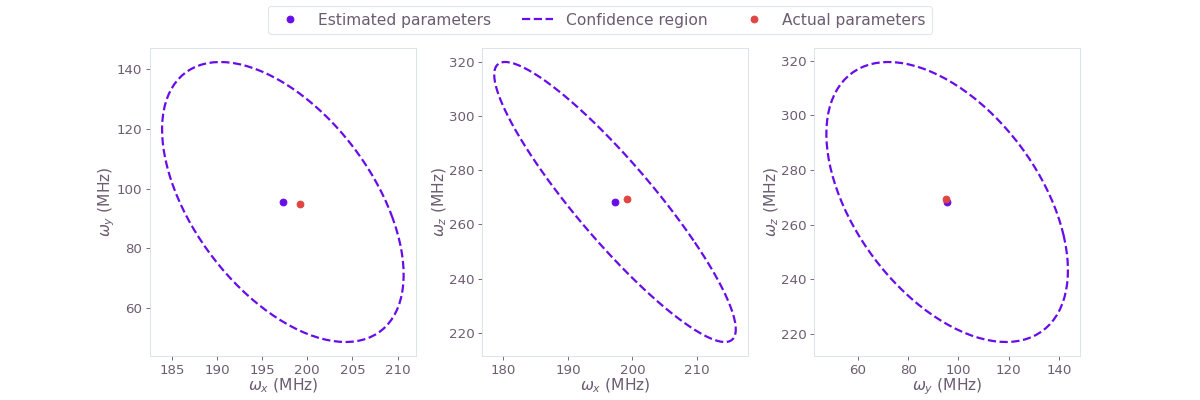
From an (N,N) matrix transformation and N estimated parameters, plots the confidence ellipse for each pair of parameters.
Parameters
- ellipse_matrix (np.ndarray) – The square matrix which transforms a unit hypersphere in an N-dimensional space into a hyperellipse representing the confidence region. Must be of shape (N, N), with N > 1.
- estimated_parameters (np.ndarray) – The values of the estimated parameters. Must be of shape (N,).
- actual_parameters (np.ndarray or None , optional) – The actual values of the estimated parameters. If you provide these, they’re plotted alongside the ellipses and estimated parameters. Must be of shape (N,).
- parameter_names (list [ str ] or None , optional) – The name of each parameter, to be used as axes labels. If provided, it must be of length N. If not provided, the axes are labelled “Parameter 0”, “Parameter 1”, …
- parameter_units (str or list [ str ] , optional) – The units of each parameter. You can provide a list of strings with the units of each parameter, or a single string if all parameters have the same units. Defaults to “Hz”.
- figure (matplotlib.figure.Figure or None , optional) – A matplotlib Figure in which to place the plots. If passed, its dimensions and axes will be overridden.
Examples
Plot the confidence ellipses for a parameter estimation from a quantum system identification task. This can be done by using the Hessian of the cost that is computed during a hardware characterization.
import numpy as np
from qctrlvisualizer import plot_confidence_ellipses, confidence_ellipse_matrix

estimated_parameters = 2 * np.pi * np.array([31.4e6, 15.2e6, 42.7e6])  # rad/s
actual_parameters = 2 * np.pi * np.array([31.7e6, 15.1e6, 42.9e6])  # rad/s
parameter_names = [r"$\omega\_x$", r"$\omega\_y$", r"$\omega\_z$"]

measurement_count = 100
cost = 0.003
hessian = np.array(
    [
        [1.51556e-17, 3.74200e-18, 5.83060e-18],
        [3.74200e-18, 1.18800e-18, 1.54420e-18],
        [5.83060e-18, 1.54420e-18, 2.46170e-18],
    ]
)

confidence_region = confidence_ellipse_matrix(hessian, cost, measurement_count)

plot_confidence_ellipses(
    confidence_region, estimated_parameters, actual_parameters, parameter_names
)