plot_bitstring_probabilities_histogram
qctrlvisualizer.plot_bitstring_probabilities_histogram(bitstring_counts, show_legend=True, rotate_x_axis_labels=True, display_all_bitstrings=False, *, figure=None)Create a histogram of the specified counts.
Parameters
- bitstring_counts (dict [ str , dict [ str , int ] ]) – Nested dictionaries of experiments with the resulting bitstring counts to plot, of the form
{"Fire Opal": {"00...0": count_0_1 , ..., "11...1": count_0_2n}, ..., "IBM": {"00...0": count_1_1, ..., "11...1": count_1_2n}}. The keys of the outer dictionary will be used for the plot legend, and the inner dictionaries keys represent the bitstrings whose counts will be plotted. The counts must be nonnegative and the length of all bitstring across all experiments must be the same. - show_legend (bool , optional) – Whether to add a legend to the plot. Defaults to True.
- rotate_x_axis_labels (bool , optional) – Whether to rotate the labels of the x-axis by 90 degrees. Defaults to True.
- display_all_bitstrings (bool , optional) – Whether to display all possible bitstrings, including those not present in bitstring_counts. Defaults to False.
- figure (matplotlib.figure.Figure or None , optional) – A matplotlib Figure in which to place the plots. If passed, its dimensions and axes will be overridden.
Examples
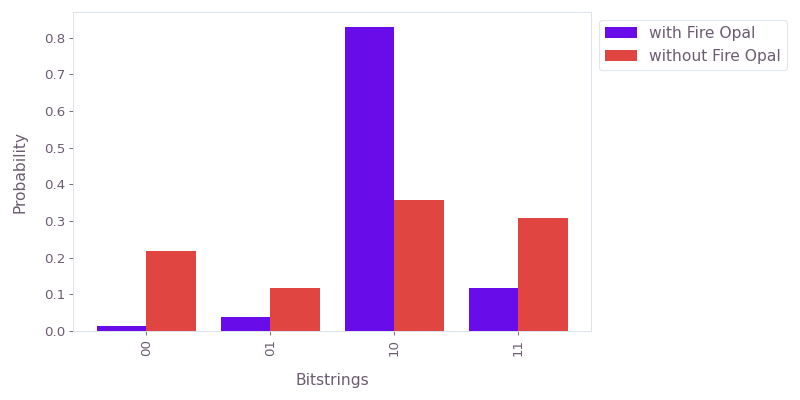
Plot a histogram of bitstring counts to compare the performance of an experiment using Fire Opal with an experiment not using Fire Opal.
from qctrlvisualizer import plot_bitstring_probabilities_histogram

bitstring_counts = {
    "with Fire Opal": {"00": 1, "01": 3, "10": 63, "11": 9},
    "without Fire Opal": {"00": 32, "01": 17, "10": 52, "11": 45},
}

plot_bitstring_probabilities_histogram(bitstring_counts)