Design robust pulses for widefield microscopy with NV centers
Increasing detection area by
Boulder Opal enables generation of controls robust to diverse noise sources in state-of-the-art quantum sensing applications. One of the prominent quantum sensor for room temperature and biocompatible applications is based on nitrogen-vacancy (NV) centers in diamond. In the their common widefield configuration, the NV sensors provide powerful microscopic 2D-imaging of magnetic and electric fields, as well as temperature emanating from the samples deposited on the sensor. In this configuration, NV centers are embedded near the surface of a relatively large diamond sensing chip leaving the sensor exposed to field inhomogeneities that limit the effective detection area.
In this application note we address this problem by designing
Imports and basic setup
import jsonpickle
import numpy as np
import matplotlib.pyplot as plt
from matplotlib.colors import LinearSegmentedColormap, TwoSlopeNorm
from matplotlib.cm import ScalarMappable

import qctrlvisualizer as qv
import boulderopal as bo

plt.style.use(qv.get_qctrl_style())


# Read and write helper functions, type independent.
def save_variable(file_name, var):
    """
    Save a single variable to a file using jsonpickle.
    """
    with open(file_name, "w+") as file:
        file.write(jsonpickle.encode(var))


def load_variable(file_name):
    """
    Load a variable from a file encoded with jsonpickle.
    """
    with open(file_name, "r+") as file:
        return jsonpickle.decode(file.read())


colors = {"Q-CTRL": qv.QCTRL_STYLE_COLORS[0], "Square": qv.QCTRL_STYLE_COLORS[1]}
use_saved_data = True
Model of the NV center under inhomogeneous field noises
The ground state of a negatively charged NV center is described by the following Hamiltonian:
where
We will run the pulses on one of two spin transitions using the resonant frequency
where
where the driving field has been absorbed into the complex Rabi rate
where the parameter
Generating robust pulses
In the cell below we show how to generate robust pulses using a stochastic optimizer.
For details on how to set up this kind of optimization please refer to this user guide.
In this example, the parameter sigma_beta), while sigma_delta).
Note that the effects of hyperfine interaction can be refined by an easy expansion of the Hamiltonian to include the nitrogen spin. The noises are introduced as a batch of (noise_sample_count).
Noise in each quasi-static point leads to a distinct Hamiltonian, allowing the optimizer to find the pulse that is simultaneously valid across a wide range of system inhomogeneities.
omega_max = 2 * np.pi * 10e6  # Maximum Rabi rate.
duration = 400e-9  # s
segment_count = 300  # Number of pulse segments.

optimization_variable_count = 100  # Degrees of freedom for the optimizer.
cutoff_frequency = 6 * omega_max  # Pulse frequency bandwidth limit.
sigma_beta = 0.4
sigma_delta = 2 * np.pi * 1.5e6
noise_sample_count = 200  # Number of samples from the noise ditibutions.
iteration_count = 2000

pi_pulse_controls = {}

if use_saved_data:
    results = load_variable("./resources/NV_widefield_pi_pulse")
else:
    print("**Optimizing pulse**")
    graph = bo.Graph()

    # Define the unitary operation of the optimized pulse.
    target_operator = graph.pauli_matrix("X")

    # Set up for optimizable controls.
    unfiltered_drive_signal = graph.complex_optimizable_pwc_signal(
        segment_count=optimization_variable_count, duration=duration, maximum=omega_max
    )
    # Filter drive signal to incorporate band limits.
    filtered_signal = graph.filter_and_resample_pwc(
        pwc=unfiltered_drive_signal,
        kernel=graph.sinc_convolution_kenrel(cutoff_frequency),
        segment_count=segment_count,
    )

    # Add envelope to pin signal to zero at start/end.
    envelope = graph.signals.cosine_pulse_pwc(
        duration=duration,
        segment_count=segment_count,
        amplitude=1.0,
        flat_duration=0.9 * duration,
    )
    drive_signal = envelope * filtered_signal
    drive_signal.name = r"$\Omega$"

    # Generate noise points to build robustness.
    # Noise representing Rabi rate inhomogeneities.
    betas = graph.random.normal(
        mean=0, standard_deviation=sigma_beta, shape=(noise_sample_count,)
    )
    # Noise representing inhomogenties in B0 and line shifts due to hyperfine coupling.
    deltas = graph.random.normal(
        mean=0, standard_deviation=sigma_delta, shape=(noise_sample_count,)
    )

    # Construct Hamiltonian terms.
    # Set up drive term.
    drive_term = graph.hermitian_part(drive_signal * graph.pauli_matrix("M"))

    # Set up quasi-static noise point terms.
    beta_signal = graph.constant_pwc(
        constant=betas, duration=duration, batch_dimension_count=1
    )
    delta_signal = graph.constant_pwc(
        constant=deltas, duration=duration, batch_dimension_count=1
    )
    delta_term = delta_signal * graph.pauli_matrix("Z") / 2.0

    # Add noise points to Hamiltonian.
    quasistatic_hamiltonian = (1 + beta_signal) * drive_term + delta_term

    # Set up cost as sum of all infidelities.
    infidelities = graph.infidelity_pwc(
        hamiltonian=quasistatic_hamiltonian, target=graph.target(target_operator)
    )
    cost = graph.sum(infidelities, name="cost")

    # Run optimization.
    results = bo.run_stochastic_optimization(
        graph=graph,
        cost_node_name="cost",
        output_node_names=r"$\Omega$",
        iteration_count=iteration_count,
    )
    save_variable("./resources/NV_widefield_pi_pulse", results)

pi_pulse_controls["Q-CTRL"] = results["output"]

# Plot controls.
qv.plot_controls(pi_pulse_controls["Q-CTRL"], polar=False, smooth=True)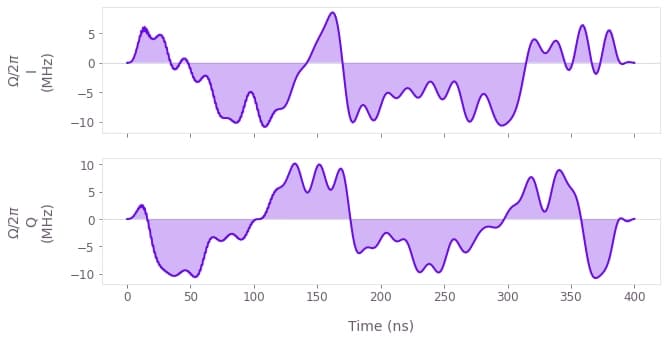
The plot above shows the I and Q components of the optimized
Robustness characterization
We will now verify the robustness of the pulse by comparing its performance with that of a simple square pulse with the same maximum Rabi rate, as defined below.
pi_pulse_controls["Square"] = {
    r"$\Omega$": {
        "durations": np.array([np.pi / omega_max]),
        "values": np.array([omega_max]),
    }
}
qv.plot_controls(pi_pulse_controls["Square"])
plt.show()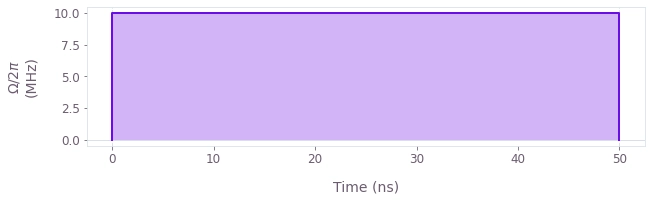
The cell below performs a quasi-static scan over the range of
betas = np.linspace(-0.9, 0.9, 50)
scan_infidelities = {}

schemes = ["Square", "Q-CTRL"]
for scheme in schemes:
    # Construct a batch of pulses experiencing different driving strengths.
    scan_controls = pi_pulse_controls[scheme]
    durations = scan_controls[r"$\Omega$"]["durations"]
    values = scan_controls[r"$\Omega$"]["values"]
    omega_values = values * (1.0 + betas)[:, None]

    # Set up the graph for the quasi-static scan simulation.
    graph = bo.Graph()
    omega_signal = graph.pwc(values=omega_values, durations=durations, time_dimension=1)
    hamiltonian = graph.hermitian_part(omega_signal * graph.pauli_matrix("M"))

    # Infidelities for detuning rates.
    infidelities = graph.infidelity_pwc(
        hamiltonian=hamiltonian,
        target=graph.target(graph.pauli_matrix("X")),
        name="infidelities",
    )

    # Calculate the graph and extract infidelities.
    graph_result = bo.execute_graph(graph, "infidelities")

    scan_infidelities[scheme] = graph_result["output"]["infidelities"]["value"]
Your task (action_id="1827934") is queued.
Your task (action_id="1827934") has started.
Your task (action_id="1827934") has completed.
Your task (action_id="1827943") is queued.
Your task (action_id="1827943") has started.
Your task (action_id="1827943") has completed.
for scheme in ["Square", "Q-CTRL"]:
    plt.plot(betas, scan_infidelities[scheme], color=colors[scheme], label=scheme)
plt.xlabel(r"$\beta$")
plt.ylabel("Infidelity")
plt.suptitle("Quasi-static scan")
plt.legend()
plt.ylim([0, 1])
plt.xlim([-1, 1])
plt.show()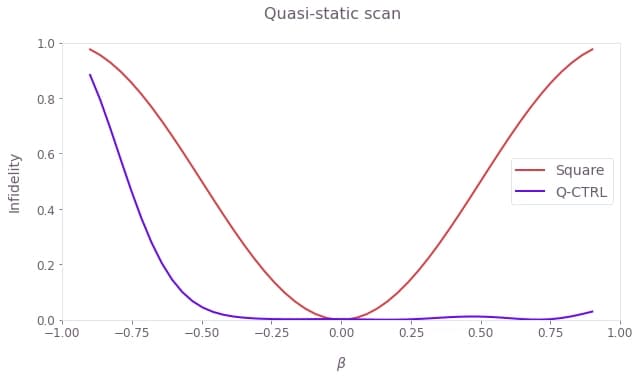
Observe that the square pulse loses its fidelity rapidly. In contrast, the optimized pulse achieves the targeted unitary operation successfully over a wide range of variations in the Rabi rate. Note that the optimized pulse remains robust to losses of the driving field amplitude up to half its peak value.
Simulating the pulse performance against spatial inhomogeneities
In this section we simulate the state evolution of NV sensors across the diamond chip surface subjected to strong microwave inhomogeneities such as those originating from a ring resonator, as shown in the figure below.
# Load data.
resonator_data = load_variable("./resources/NV_widefield_resonator_data")
rabi_profile = resonator_data["rabi_profile"]
x_points = resonator_data["x_points"]
y_points = resonator_data["y_points"]
X, Y = np.meshgrid(x_points, y_points)
plot_rabi_rates = rabi_profile * omega_max / (2 * np.pi * 1e6)

fig, ax = plt.subplots(figsize=(8, 5))
fig.suptitle("Rabi rate profile")
ax.set_xlabel("x (mm)")
ax.set_ylabel("y (mm)")
ax.set_aspect(1)

contours = plt.contour(
    X / 1e-3,
    Y / 1e-3,
    plot_rabi_rates,
    levels=np.array([0.9, 1.1]) * 10,
    colors="#6C5C71",
    linestyles="-",
    linewidths=0.75,
)
fmt = {level: label for level, label in zip(contours.levels, ["10%", "+10%"])}
plt.clabel(contours, inline=True, fmt=fmt, fontsize=10)

qctrl_cmap = LinearSegmentedColormap.from_list(
    "Q-CTRL_colormap",
    ["#C02C21", "#FA7370", "#FED6D7", "#FFFFFF", "#EDE0FE", "#B482FA", "#680CE9"],
    N=200,
)
extent = 1e3 * np.array([min(x_points), max(x_points), min(y_points), max(y_points)])
image = plt.contourf(
    plot_rabi_rates,
    extent=extent,
    levels=100,
    cmap=qctrl_cmap,
    norm=TwoSlopeNorm(vcenter=10.0),
)
cbar = fig.colorbar(image, ticks=np.arange(2, 17, 2))
cbar.set_label(label="Rabi rate (MHz)")

plt.show()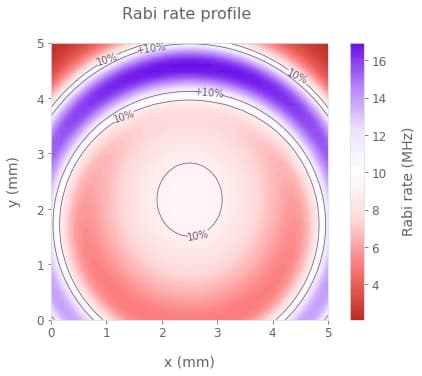
The profile above shows the Rabi rate inhomogeneities with spatial variations across the widefield sensor area that will be used in the simulation.
The chip is assumed to be uniformly populated by the NV centers while effects of coherence time limits are omitted for clarity.
The pulse durations are set by the ideal Rabi rate (white in the image above), causing the variations to impact the effective signal contrast by limiting the maximal population inversion achieved by the
states_pi_pulse = {}
for scheme, controls in pi_pulse_controls.items():
    durations = controls[r"$\Omega$"]["durations"]
    phasors = controls[r"$\Omega$"]["values"]

    # Construct a 2D profile of Rabi rate inhomogeneities in a batch format.
    phasors = phasors * rabi_profile[:, :, None]

    duration = np.sum(durations)
    initial_state = np.array([1.0, 0.0])

    # Start graph definition.
    graph = bo.Graph()
    omega_signal = graph.pwc(values=phasors, durations=durations, time_dimension=-1)
    hamiltonian = graph.hermitian_part(omega_signal * graph.pauli_matrix("M"))

    # Infidelities for detuning rates.
    unitaries = graph.time_evolution_operators_pwc(
        hamiltonian=hamiltonian, sample_times=[duration], name="unitaries"
    )
    evolved_states = unitaries @ initial_state[:, None]
    evolved_states.name = "evolved_states"

    # Execute the graph.
    result = bo.execute_graph(graph, ["evolved_states", "unitaries"])
    # Extract and return infidelities.
    states_pi_pulse[scheme] = result["output"]["evolved_states"]["value"][:, :, 0, :, 0]
Your task (action_id="1827965") is queued.
Your task (action_id="1827965") has started.
Your task (action_id="1827965") has completed.
Your task (action_id="1827972") is queued.
Your task (action_id="1827972") has started.
Your task (action_id="1827972") has completed.
We now compare the widefield performance of the sensor under the square and the optimized pulses.
fig, axs = plt.subplots(1, 3, figsize=(18, 5))

contour_area = {}
for idx, (scheme, states) in enumerate(states_pi_pulse.items()):
    plot_state = 1
    populations = np.abs(states[:, :, plot_state]) ** 2
    contour_area[scheme] = np.sum(populations > 0.99)

    axs[idx].set_title(f"{scheme} π pulse")
    axs[idx].set_xlabel("x (mm)")
    axs[idx].set_ylabel("y (mm)")
    axs[idx].set_aspect(1)

    # Contours.
    contours = axs[idx].contour(
        X / 1e-3,
        Y / 1e-3,
        populations,
        levels=[0.7, 0.99],
        colors=["#6C5C71", "#E9E7EA"],
        linewidths=0.75,
    )
    axs[idx].clabel(contours, inline=True, fontsize=10)
    # Gradient image.
    image = axs[idx].contourf(
        populations,
        extent=extent,
        levels=300,
        cmap=qctrl_cmap,
        norm=TwoSlopeNorm(vcenter=0.9, vmin=0.0, vmax=1.0),
    )
cbar = fig.colorbar(
    ScalarMappable(cmap=qctrl_cmap),
    ticks=np.arange(0.0, 2, 0.2),
    ax=[axs[0], axs[1]],
    pad=0.03,
    shrink=0.92,
)
cbar.set_label(r"$P_{|-1\rangle}$")

# Bar chart.
boost = contour_area["Q-CTRL"] / contour_area["Square"]

axs[2].set_title(f"{boost:1.1f}× sensing area boost")
axs[2].set_ylabel("Relative surface area, >99% fidelity", labelpad=10)
axs[2].set_xlim(0, 2)
x_pos = [0.5, 1.5]
axs[2].set_xticks(x_pos, colors.keys())
axs[2].bar(x_pos, [boost, 1], width=0.4, color=colors.values())

plt.show()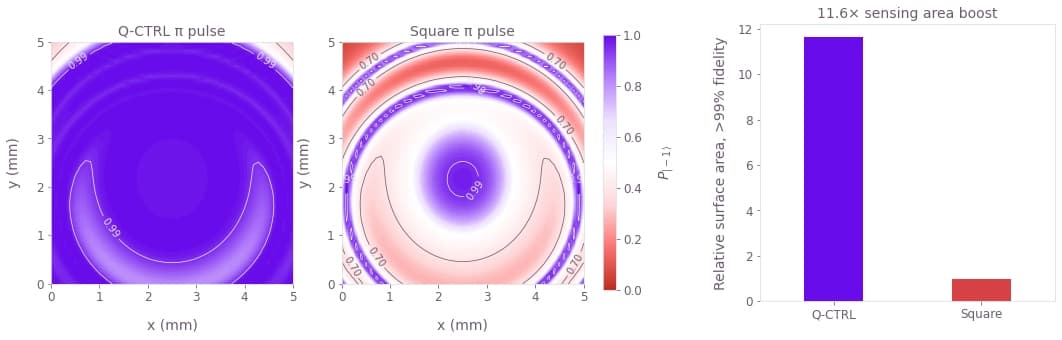
We see the population contrast achieved by the pulses over the entire field of view of the chip. The performance of the square pulse diminishes quickly with the Rabi rate deviation, leaving only a small area of high effective contrast. In comparison, the optimized pulse achieves uniform performance over most of the sensing area.
Overall we see that in this particular example, the optimized pulse expands the area of 99% effective contrast by over 10 times. However, it's worth noting that our optimization strategy generates pulses whose performance does not depend on the specific manifestation of the spatial inhomogeneities, making the optimized pulses versatile in NV sensing applications under varying environmental conditions.
